
Single-Family Leads | Inventory Expanding | Fundamentals Remain Strong
The market showed notable variance across property types, with single-family homes outperforming condominiums both year-over-year and quarter-over-quarter. The number of single-family sales transactions were up 6% year-over-year, with a median price increase of 18% to $1.97M. Condominium sales across the primary market area were down 17% with a median price steady year-over-year at $1.15M. Year-over-year totals smooth seasonal swings and reflect a larger transaction sample, giving a truer read on market direction.
Key Market Trends shaping Q1 2026
Prices & Activity I Park City Proper
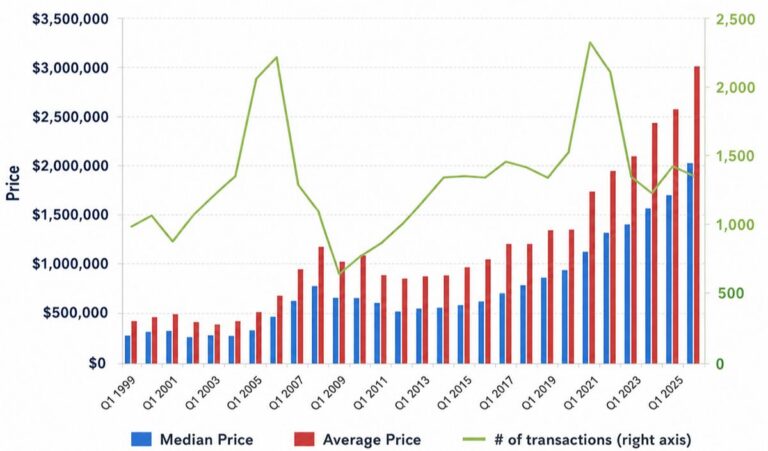
Source: Rick Klein and Park City Multiple Listing Service, Q1 2026 Statistics Report
Since January 2001, prices have appreciated at an annual average rate of 7.1% (compounded monthly).
Inventory continued its slow but steady recovery, with total active listings for Greater Park City settling into a range of 800 to 900 listings, up 13% compared to the year prior.
As always, there is a great deal of segmentation in our market, with sales activity varying substantially across neighborhoods, property types, and age/condition. But the big takeaway is that our market continues to be stable and resilient. Prices across all property types in Greater Park City have appreciated 7.1% annually since the beginning of 2001 – that is a quarter century of remarkable appreciation!
Read on to see how your areas of interest fared, and please reach out if you have any questions about buying or selling here in Park City and the Wasatch Back.
Inventory Levels: Highest in Years
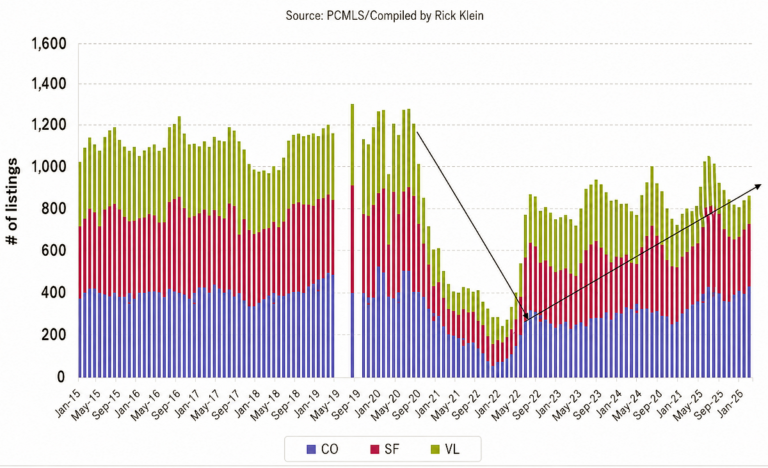
Greater Park City | SF + Condos + Land
Supply conditions continued to improve through the 1st Quarter of 2026, with active listings up 13% year-over-year to 889 listings in the Greater Park City area as of April 1st.
Inventory changes by property type were as follows:
• Single-family inventory was up 7%
• Condominium inventory was up 31%
• Vacant land inventory was down 13%
The overall absorption rate for single-family homes and condominiums increased to 8.4 months, which is the highest level since March 2020. This current rate resembles the pre-COVID years of 2013-2019, where the absorption rate was 7.2 months.
New Construction
New construction in the Park City area played a major role in shaping inventory, especially in Jordanelle, Heber, and Kamas. The portion of new-construction listings as of March 2026 were as follows:
Park City: 9% of condominium listings / 17% of single-family listings
Snyderville: 4% of condominium listings / 14% of single-family listings
Jordanelle: 48% of condominium listings / 75% of single-family listings
Heber: 31% of single-family listings
Kamas: 26% of single-family listings
Q1 Record Sale
258 White Pine Canyon Road
Q1’s highest sale was an extraordinary newly completed estate in The Colony at White Pine Canyon. Offering over 15,200 square feet of luxury living on 6.22 acres, the home features timeless modern mountain architecture, ski room, sauna, treatment rooms, golf simulator, and direct ski access in one of Park City’s most exclusive communities.
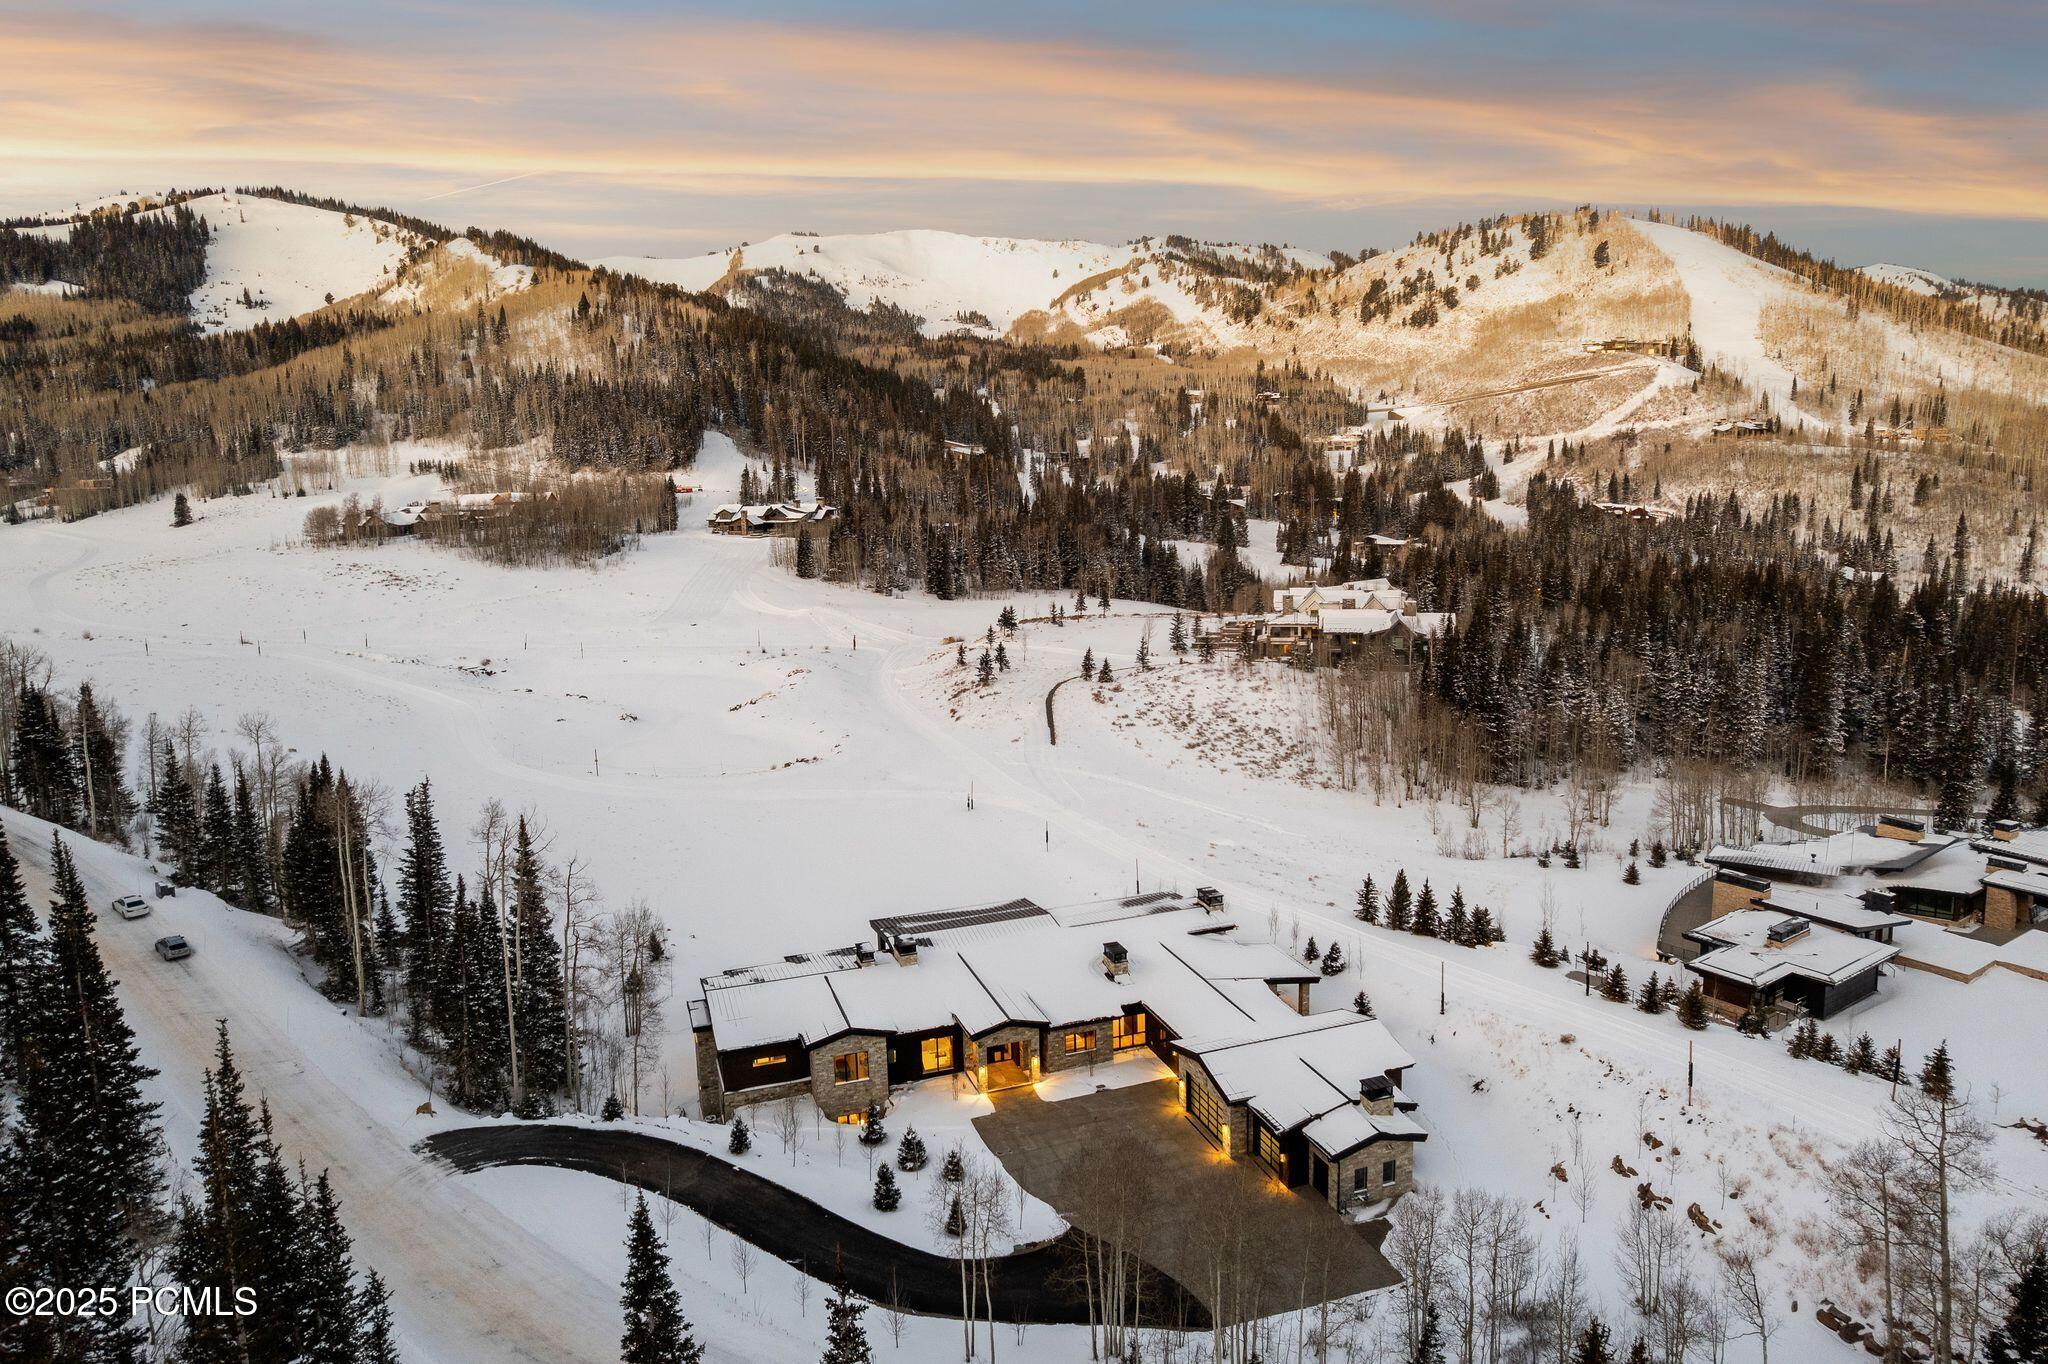
Listing Courtesy of BHHS Utah Properties
Park City Real Estate Market Trends by Neighborhood
Park City Limits I Market Overview
SINGLE-FAMILY Homes
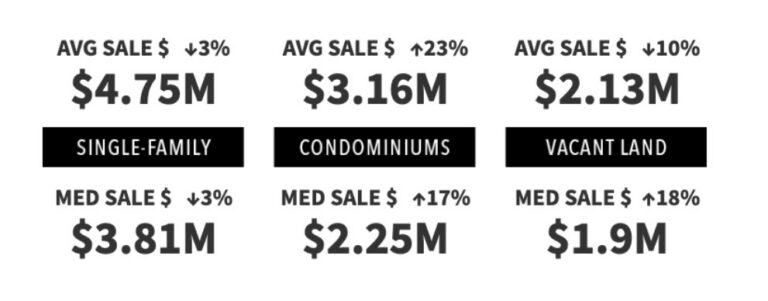
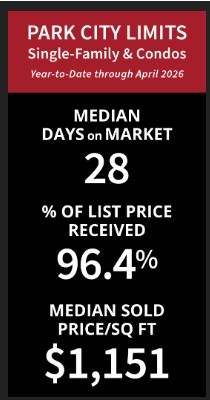
Within Park City limits, the median home price dipped 3% to $3.8 million on 136 total closings – a 9% increase in sales activity. Old Town had 52 home sales, up 53% from the previous twelve-month period, while the median price dropped 4% to $3.5 million. In Thaynes Canyon, 9 homes closed with a median price of $4.0 million, down 12% over the prior year. Lower Deer Valley experienced a 6% decline in median price to $4.2 million on 9 total sales, while Deer Crest recorded 3 closings with the median price up 12% to $13.5 million. Upper Deer Valley had 5 closings and a 1% increase in median price to $7.3 million.
Empire Pass had 7 closed sales with a 2% dip in median price to $14.4 million. Aerie had 4 closings with a median price surge of 28% to $5.1 million, while Prospector’s 15 total sales led to a 9% increase in median price to $2.4 million. Rounding out the area, Park Meadows recorded 32 closings with a 7% dip in median price to $3.4 million.
Condominiums
Within Park City limits, condominium sales were down 8% on 245 total closings, while the median price climbed 17% to $2.25 million. Old Town closed sales declined 12% with 81 closings, and the median price dipped 2% to $1.2 million. In Lower Deer Valley, there were 53 closings, accompanied by a 30% increase in median price to $2.9 million. Sales in Deer Crest dipped 10% with 28 closings, while the median price climbed 38% to $5.8 million. In Upper Deer Valley, sales were down 5% on 19 closings, with a 22% increase in median price to $5.1 million. Empire Pass had 15 closings with a 31% median price increase to $7.1 million. Prospector saw a slowdown, with a 44% drop in sales on 20 closings, but the median price increased 16% to $440K. Park Meadows posted a 4% decrease in closings with 27 total sales, and the median price fell 9% to $1.3 million.
Average & Median Sale Prices
1st Quarter 2026 Year-Over-Year Rolling Averages
Neighborhood Highlights - Snyderville Basin
SINGLE-FAMILY Homes
During the past twelve months in Canyons Village there were 9 homes sold with median price soaring 78% to $17.5 million. Sun Peak/Bear Hollow had 20 closings with a robust 28% increase in median price to $2.9 million. Silver Springs had 22 sales with a 10% rise in median price to $2.5 million, while Old Ranch Road dropped 15% to a $5.0 million median price on 9 transactions.
Kimball Junction was active with 14 closings and a 3% gain in median price to $1.24 million. Further east, Pinebrook recorded 20 closings with a 9% increase to $1.9 million, and Jeremy Ranch logged 48 closings with a 14% rise to $2.2 million.
Summit Park had 34 closed sales with a 2% median sale price increase to $1.3 million. Glenwild posted 18 sales with a 16% rise in median price to $5.9 million, while nearby Silver Creek Estates experienced an 11% decrease to $2.3 million on 20 closings. Trailside Park recorded 22 closed sales with a 9% drop in median price to $1.6 million, and Silver Creek South had 25 sales with a 5% decrease in median price to $1.1 million. Promontory remained one of the most active neighborhoods in the Basin with 115 total closings, with a median price increase of 18% to $4.9 million.
Condominiums
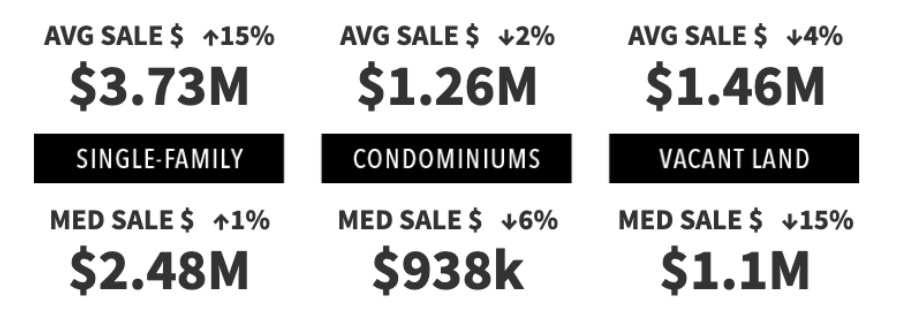
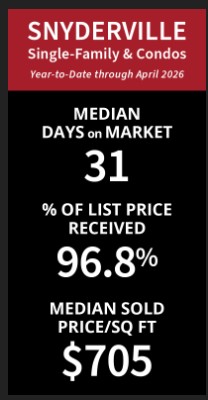
Condominium sales in the Snyderville Basin dipped 11% with 230 total closings, and the median price declined 6% to $938,000. Canyons Village activity was down 10% on 104 closings, but the median price ticked up 1% to $1.3 million. Sun Peak/Bear Hollow had 19 sales and a 31% increase in median price to $1.2 million. Kimball recorded 47 sales with a 4% rise in median price to $675,000, while Pinebrook had 29 closings and a 2% dip in median price to $941,000. Jeremy Ranch registered 9 condominium sales at a median of $1.2 million, down 6%, and Silver Creek South had 17 closings with a 15% decrease in median price to $850,000.
Average & Median Sale Prices
1st Quarter 2026 Year-Over-Year Rolling Averages
Neighborhood Highlights - Jordanelle
SINGLE-FAMILY Homes
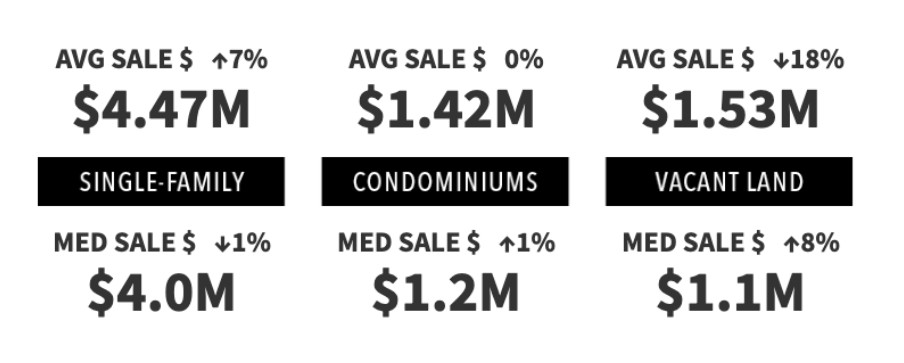
Across the greater Jordanelle area there were 127 total closings, with the median price ticking down 1% to $4 million. Mayflower-Jordanelle recorded 24 sales with median price flat at $4 million. Tuhaye posted a 6% dip in median price to $5.3 million on 31 closings, while Hideout logged 27 sales with a 7% rise in median price to $2.7 million. Deer Mountain saw 14 closings and a 41% decline in median price to $1.8 million. Rounding out the area, South Jordanelle registered 30 sales and a 3% uptick in median price to $4.3 million.
Condominiums
Across all of Jordanelle, condominium closings dropped 33% on 216 closings, with median price ticking up 1% to $1.2 million. The median price in the Mayflower–Jordanelle area climbed 60% to $2.0 million on 55 total sales. Deer Mountain recorded 45 closings with a median price decline of 7% to $929,000. South Jordanelle had 14 closings with a 10% increase in median price to $1.2 million. Deer Valley East Village had 16 closings, but the median price dropped 50% to $480,000, while Hideout posted 86 closings and a 16% increase in median price to $1.7 million.
Average & Median Sale Prices
1st Quarter 2026 Year-Over-Year Rolling Averages
Heber Valley I Market Overview
SINGLE-FAMILY Homes
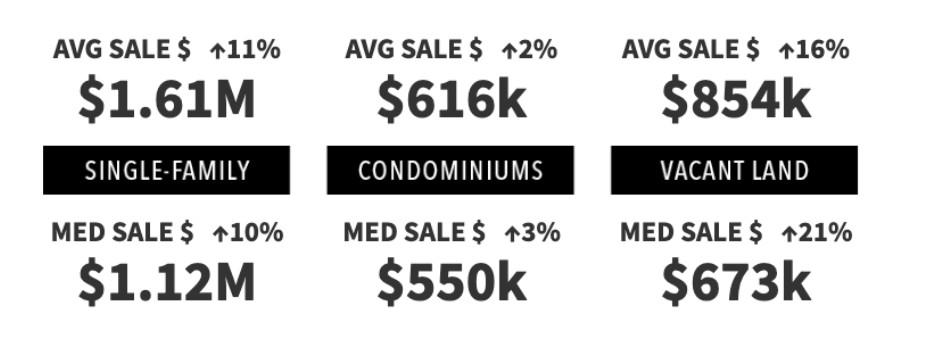
Single-family home sales across the Heber Valley rose 5% with 343 total closings, accompanied by a 10% increase in median price to $1.1 million.
Midway recorded 85 closings and a 6% median price increase to $1.2 million. Red Ledges had 56 sales, with the median price down 11% to $3.0 million. South Fields logged 17 closings and a 4% dip in median price to $708,000.
Heber proper had 70 sales with a 9% dip in median price to $693,000, while Heber East posted 37 closings and a 4% drop in median price to $1.35 million. Heber North saw 25 sales and an 8% median price increase to $865,000. Timber Lakes rounded out the area with a 2% dip in median price to $789,000 on 29 closings.
Condominiums
The condominium market in Heber Valley posted 87 total closings, with a slight 3% increase in median price to $550,000.
Midway registered 22 closings and a 3% drop in median price to $478,000. Red Ledges recorded 6 sales and a 6% decrease in median price to $1.5 million. In Heber proper, 19 sales closed with median price down 14% to $410,000, while Heber North saw 35 closings with a 6% drop in median price to $550,000.
Average & Median Sale Prices
1st Quarter 2026 Year-Over-Year Rolling Averages
This report has been created in cooperation with KW Park City Keller Williams Real Estate, with stats provided by Rick Klein and the Park City Multiple Listing Service Quarter 1 2026 Statistics Report.
Curious how These trends affect your property or buying strategy?
Having helped buyers and sellers in Park City for over a decade, we continue to see strong demand driven by lifestyle, limited inventory, and long-term investment potential.
Please know that we prepare complimentary market analyses for homeowners throughout Park City, Deer Valley, Canyons Village, Promontory, Jordanelle, Heber Valley, Midway, and the surrounding Wasatch Back.
Call Drew Via & Annett Blankenship
The Park City Investor Team
KW Park City – Keller Williams Real Estate
435.640.6966
What's Your Home Worth? Find Out Now, For Free!
Contact a Park City Real Estate Agent:
FAQ
Most frequently asked questions about the Park City real estate market
Is now a good time to buy a home in Park City?
With inventory increasing and the market becoming more balanced, buyers have more choices than they did during the peak of the seller’s market. However, desirable properties—especially luxury homes and ski properties—continue to attract strong demand.
Are Park City home prices still increasing?
Overall, the Park City real estate market has remained resilient. While appreciation varies by neighborhood and property type, long-term home values have averaged approximately 7.1% annual appreciation since 2001.
Is inventory increasing in Park City?
Yes. Active inventory increased 13% year over year in Q1 2026, giving buyers more options while remaining well below historical highs.
Which Park City neighborhoods performed best?
Performance varied by neighborhood. Communities such as Promontory, Canyons Village, Empire Pass, Hideout, and Kimball Junction continued to experience strong buyer demand, while other areas saw more balanced conditions.
Will the Deer Valley East Village expansion affect home values?
The continued development of Deer Valley East Village is expected to increase interest in nearby communities such as Hideout, Mayflower, Deer Mountain, and Jordanelle by expanding year-round amenities and ski access.